Research and Evidence-Informed Education

This blog’s aim is to bring research and evidence to bear on educational questions. I also plan to explore some over-arching questions about the methods and methodology of applied social research, knowledge exchange and use, and ‘evidence-informed’ policy and practice.

I do not expect to blog regularly, mostly as a way of bringing research papers (mine and others’) to a wider audience. Nonetheless, I hope it will be worth watching this space for when I do. You can follow the blog by email by putting your email on the right. I promise not to flood your inbox with too many ramblings!

Here are some blogs I have written so far:

CPDL

Using Evidence

Accountability

Ed Policy

Advertisement

ResearchED Brum 2022

A fantastic and informative day at ResearchED Brum yesterday. Great to talk to and hear from so many interesting people and to see some old friends too!

I said in my session I would share my slides for anyone interested in following links or looking back over them.

Here they are:

Please do get in touch with me (@TWPerry1 or tom.perry@warwick.ac.uk) with anything education research methods/evidence-informed policy and practice etc. (more about me here)

A huge thanks to Claire, Andy and all for such a stumulating day!

A Rapid Review of Remote and Blended Teacher Education: What is it? Does it work? How can we make it effective?

Read the full research report: <link>

Getting to Grips with Remote and Blended Teacher Education

The Covid-19 pandemic has forced educators to shift to remote and blended education approaches at an unprecedented scale and speed. This shift includes teacher educators supporting pre-service teachers and continuing professional development providers. Many teacher educators are now expanding their remote learning provision and, in some cases, getting to grips with remote teacher education for the first time.

This summer, a team based at the Department of Teacher Education, University of Birmingham, were asked by STEM Learning to review the literature on teacher education modality (i.e. face-to-face, remote and blended modes) and see what could be learnt. Both organisations have a strong commitment to evidence-informed teacher education and were in the process of developing teacher education programmes for the new academic year.

We were supported with expert support and assistance from Prof. Philippa Cordingley and Bart Crisp, from the Centre for the Use of Research and Evidence in Education (CUREE), in particular to link up and explore our results alongside the evidence on effective continuing professional development and learning (CPDL), and initial teacher education (ITE).

Reviewing the Evidence

Our findings follow an EEF rapid evidence assessment released last week. With time restrictions and anticipating a limited evidence base, the EEF focused on existing systematic reviews and meta-analysis in education, welfare and public health, obtaining 17 reviews, of which 7 directly related to school-based professionals. We refer to their results alongside our findings below.

Our rapid review, completed over the course of about 4 weeks, obtained and screened 7,354 research papers from 5 search databases, containing dozens of library collections to find out. The research report is based on inspection and analysis of 22 reviews and reports, 24 empirical studies and 19 background and wider pieces.

Also anticipating limitations in the evidence base, our approach – as well as reporting the small number of studies testing and comparing remote and online programmes – includes more theory-rich and exploratory sections.

So, after some hot summer days working our way through and interrogating thousands of research papers, what have we learnt?

The Theory

Remote and Blended Teacher Education: What is it?

We identified and describe six general modes of online or blended teacher education:

  • Lectures, workshops, seminars, discussion groups or conferences.
  • Coaching and mentoring
  • Classroom observations with feedback and/or discussion
  • Resource bases or repositories
  • Platforms and self-study programmes
  • Virtual reality spaces or simulation

In our report, we discuss various cross-cutting factors that characterise remote and blended teacher education in these modes including for example their level of (a)synchronicity, interactivity, community-formation, choice of (multi-)media, elements and focus.

Can Effective Teacher Education be Achieved in Remote and Blended Programmes?

Our review started with the premise that we should not be confusing the medium (and the structure) of teacher education for the message. Like the EEF, we are of the view that the mode of teacher education is only one of numerous design principles, and perhaps one of the less important ones.

Accordingly, we have explored the literature on remote and blended teacher education alongside those on Continuing Professional Development and Learning (CPDL) and its leadership, and for effective Initial Teacher Education (ITE).

Our focus was on understanding whether/how principles for effective teacher education can be achieved within remote and blended approaches, and the affordances and limitations of different modes.

In overview, taking an exploratory, and theoretical perspective, the potential of remote and blended teacher education appears promising. Both positives and challenges are evident in the literature.

The Positives:

  • Our overall reading of the literature is that there is no reason why remote and online teacher education cannot achieve principles of effective learning design in teacher education such as an orientation to pupil outcomes, differentiation for teacher starting points, support for high quality collaboration and reflective practice, and so on.
  • The literature suggests that in some cases these can be made easier and richer through artefacts, tools and the technologies of blended and online learning that bring together teaching practice, pupil learning, and new ideas for examination, discussion and reflection.
  • Like the EEF, we think that video technology is of particular note as it has the potential to bring classroom interactions into a teacher education space without the expense of face-to-face observations (i.e. around release time) and the reliance on memory – which will be most fresh immediately after the teaching and increasingly distant as time passes. There is also the benefit in the present pandemic of reducing face to face contact and thereby lowering Covid-19 transmission risk.
  • Online modes and technology can be used to assemble larger groups, which are more likely to incorporate and/or find it more economical to draw on specialist expertise. It is also possible to wrap community elements around teacher education approaches to encourage and sustain collaboration and provide professional support and expertise.
  • Flexibility around timings and online approaches can help teachers fit learning around their professional commitments and school timetables, avoiding the need to use weekend days for group activity and better fit with personal circumstances. Also, as the EEF note, school leaders remain important for enabling good conditions for teacher learning.

The Challenges:

  • When it comes to high-quality collaboration in a remote and blended space, a key concept is that of ‘presence’. While high presence appears to be possible, it also seems to need careful consideration when designing remote and blended teacher education. A symptom of where this challenge is not addressed is high participant attrition and non- or highly-passive participation. Blended approaches and/or online learning with groups with a pre-established relationship seem to help address this challenge.
  • There are also some challenges with accessibility when using technology, ranging from the basics of getting things working, to difficulties related to differing expectations around participation, and preconceptions about these, which seem to vary with teacher education modes. Introduction of formal or informal rules and etiquettes is put forward in the literature as potential ways to address issues around engagement expectations. The literature also discusses the value of facilitators, tutors and peers modelling effective and positive engagement.

The Evidence

In our evidence review section, we report results from 24 empirical studies meeting our inclusion criteria: 19 present empirical results about whether remote or blended programmes can have an impact on pupils. 5 include consideration of more than one mode (remote, blended and/or face to face) and thereby enable a form of comparison between modes.

The Efficacy of Remote and Blended Teacher Education

  • Coaching and mentoring interventions – showed positive results for changing teacher practice and mixed results for positive pupil impact (just like face-to-face CPD). Like the EEF (who note mentoring and coaching can be effective alone or part of a broader PD programme), we conclude that the evidence base is strongest and most positive in this area, although this may reflect limitations in what has been evaluated within standardised programmes (and systematically researched and reviewed) in addition to the effectiveness of the mode.
  • Mixed component interventions – similar to the coaching and mentoring programme evaluations, evaluations of mixed component interventions tended to report changes in teacher outcomes such as pedagogical content knowledge, but again there was a mixed picture when it comes to pupil outcomes, with some studies finding positive effects and some finding none.

Overall, this very small evidence base suggests that remote and blended teacher education programmes can, and often do, have an impact on teacher outcomes, and can, but often don’t have an impact on student outcomes (something that could also be said of face-to-face CPD).

Comparing Remote and Blended to Face-to-Face Modes

Remote and blended teacher education is a relatively new field of practice and study. There are few studies that enable firm conclusions to be drawn on the relative effectiveness of modes and approaches.

The few studies we have to go on (i.e. which allow fair comparison between similar content in different modes or combination of approaches) suggest that there is little difference in effectiveness.

There are tantalising findings about combining components such as coaching and mentoring with video lesson observations, curriculum materials and/or CPD – but with such a limited evidence base, drawing conclusions would be over-reaching.

What’s Next?

Our report:

  • Finds that remote and online teacher education can be effective
  • Offers some tantalising findings and exploratory analysis around the promise of technology and blended approaches

As we discuss in our report, the field would benefit from ‘research-based design principles to guide the ongoing development, implementation, and evaluation efforts in online PD’. We have not yet reached this point, but we hope that our theoretically-rich and exploratory approach serves as a starting point and provides a set of working principles for online or blended teacher education design and research.

In our view, remote and blended teacher education approaches show considerable promise; appear to have distinct advantages and disadvantages relative to solely face-to-face approaches; and already are and are likely to increasingly become important parts of the teacher education landscape.

But at present, it is largely down to teacher educators and school leaders to work out how to make remote and blended teacher education work in practice. We wish them every success!

Find out more in our report: <link>

Find out more about the lead author:

Dr Tom Perry
Twitter: @TWPerry1
Website:  thomasperry.education

Using Data in Schools – Some Reading


In response, some general ‘data’ reading. No space here to offer critque of all of this (but see comment underneath)

Some quick thoughts of my own here:

A lot of this is that we get the cart before the horse and use data to drive other things, rather than feed data into other school policies/practices/decision-making. I think we are far better finding a school practice first, and seeing how data can help. So, for example, schools conduct self/peer evaluation – what kind of data will be useful as part of this? What kind of data will be useful when reviewing curriculum? Teacher performance? etc.

Lambeth report for example (above) talks about using data to pose questions and pulling it together with other sources, professional judgement etc. Workload Advisory report talks a lot about purpose. I think these have it right.

In contrast, using data, flight paths, targets etc. etc. to ‘drive’ what goes on puts far too much weight on the data given what we know about its validity and reliability.

Also worth mentioning that validity is increasingly thought about in terms of interpretation and use (see Kane, 2013). So poor interpretation and use of data is a bigger problem in my view than (inevitably) imperfect data. ‘It is not what you do, it is the way that you do it’ and all..

I hope that helps.

Tom

https://thomasperry.education/


Ref.

Kane, M. T. (2013). Validating the interpretations and uses of test scores. Journal of Educational Measurement50(1), 1-73.

School progress measures are a missed opportunity for a fairer and more informative approach

This blog piece was originally published on The University of Birmingham’s Social Sciences  Blog (link) (May, 2018)


The Progress 8 measures of school performance compare pupils’ GCSE results across 8 subjects to those of other pupils with the same primary school SATs results. There are many reasons behind the differences we see in the scores, many of which have nothing to do with school quality. They tell us surprisingly little about school performance.

It is easy to find fault in performance measures, and there is certainly a lot of ammunition to do this in the case of the Progress 8 measures. However, in my research, I work towards improving education policy and practice, rather than merely criticising the status quo. So here are five ways to reform the school Progress measures:

1. Fix the ability bias:

Progress measures help us see pupil progress relative to similar-ability peers in other schools. But, as my recent research has shown, error in the measures used to estimate ability means that a sizable ‘ability bias’ remains, giving a particularly large advantage to selective grammar schools. Ability bias can be rectified by looking at average school starting points as well the starting points for individual pupils (or more sophisticated methods which estimate and correct for measurement unreliability).

2. Replace or supplement Progress 8 with a measure that  takes context into account:

My paper, published when the first Progress measures were introduced in 2016 found that around a third of the variation in Progress 8 can be accounted for by a small number of school intake characteristics such as the proportion of pupils on free school meals and/or with English as an additional language (EAL). Using more sophisticated measures would reveal further predictable differences unrelated to school quality (e.g. considering EAL groups, the number of years pupils are on Free School Meals, or factors such as parental education). We must guard against measures excusing lower standards for disadvantaged groups. But not providing contextualised estimates leaves us with little more than impressions on how interacting contextual factors influence outcomes and no one in a position to make data-informed judgements.

3. Create measures which smooth volatility over several years:

Progress 8 is highly affected by unreliable assessments and statistical noise. Only a tiny portion of Progress 8 variation is likely to be due to differences in school performance. A large body of research has revealed very low rates of stability for progress (value-added) measures over time. Judging a school using a single year’s data is like judging my golfing ability from a single hole. A school performance measure based on a 2- or 3-year rolling average would smooth out volatility in the measure and discourage short-termism.

4. Show the spread, not the average:

It is not necessary to present a single score rather than, for example, the proportion of children in each of 5 progress bands, from high to low. Using a single score means that, against the intentions of the measure, the scores of individual students can be masked by the overall average and downplayed. Similarly, the measure attempts to summarise school performance across all subjects using a single number. Schools have strengths and weaknesses and correlations between performances across subject are moderate at best.

5. Give health warnings and support for interpretation:

Publishing the Progress measures in ‘school performance tables’ and inviting parents to ‘compare school performance’ does little to encourage and support parents to consider the numerous reasons why the scores are not reflective of school performance. Experts have called for, measures to be accompanied by prominent ‘health warnings’ if published. Confidence intervals are not enough. The DfE should issue and prominently display guidance to discourage too much weight being placed on the measures.

Researchers in this field has worked hard to make the limitations of the Progress measures known. The above  recommendations chime with many studies and professional groups calling for change.

Trustworthy measures of school performance are currently not a realistic prospect. The only way I can see them being informative is through use in a professional context, alongside many other sources of evidence – and even then I have my doubts.

How much confidence should we place in a progress measure?

This blog piece was originally published on the SSAT Blog (link) (December, 2017)


Our latest cohort of students, all current or aspiring school leaders, have been getting to grips with school performance tables, Ofsted reports, the new Ofsted inspection dashboard prototypes, the Analyse School Performance (ASP) service and some examples of school tracking data. As they write their assignments on school performance evaluation, I realise others might be as interested as I have been in what we are learning.

There was a general agreement in the group that using progress (ie value-added) indicators rather than ‘raw’ attainment scores give a better indication of school effectiveness. As researchers have known for decades and the data clearly show, raw attainment scores such as schools’ GCSE results say more about schools’ intakes than their performance.

Measuring progress is a step in the right direction. However, as I pointed out in an (open access) research paper on the limitations of the progress measures back when they were introduced, a Progress 8 measure that took context into account would shift the scores of the most advantaged schools enough to put an average school below the floor threshold, and vice versa.

Confidence lacking in confidence intervals

Recent research commissioned by the DfE suggests that school leaders recognise this and are confident about their understanding of the new progress measures. But many are less confident with more technical aspects of the measure, such as the underlying calculations and, crucially, the accompanying ‘confidence intervals’.

Those not understanding confidence intervals are in good company. even the DfE’s guidance mistakenly described confidence intervals as ‘the range of scores within which each school’s underlying performance can be confidently said to lie’. More recent guidance added the caveats that confidence intervals are a ‘proxy’ for the range of values within which we are ‘statistically’ confident that the true value lies. These do little, in my view, to either clarify the situation or dislodge the original interpretation.

A better non-technical description would be that confidence intervals are the typical range of school progress scores that would be produced if we randomly sorted pupils to schools. This provides a benchmark for (but not a measure of) the amount of ‘noise’ in the data.

Limitations to progress scores

Confidence intervals have limited value however for answering the broader question of why progress scores might not be entirely valid indicators of school performance.

Here are four key questions you can ask when deciding whether to place ‘confidence’ in a progress score as a measure of school performance, all of which are examined in my paper referred to above on the limitations of school progress measures:

  1. Is it school or pupil performance? Progress measures tell us the performance of pupils relative to other pupils with the same prior attainment. It does not necessarily follow that differences in pupil performance are due to differences in school (ie teaching and leadership) performance. As someone who has been both a school teacher and a researcher (about five years of each so far), I am familiar with the impacts of pupil backgrounds and characteristics both on a statistical level, looking at the national data, and at the chalk-face.
  2. Is it just a good/bad year (group)? Performance of different year groups (even at a single point in time) tends to be markedly different, and school performance fluctuates over time. Also, progress measures tell us about the cohort leaving the school in the previous year and what they have learnt over a number of years before that. These are substantial limitations if your aim is to use progress scores to judge how the school is currently performing.
  3. Is an average score meaningful? As anyone who has broken down school performance data by pupil groups or subjects will know, inconsistency is the rule rather than the exception. The research is clear that school effectiveness is, to put it mildly, ‘multi-faceted’. So asking, ‘effective for whom?’ and, ‘effective at what?’ is vital.
  4. How valid is the assessment? The research clearly indicates that these measures have a substantial level of ‘noise’ relative to the ‘signal’. More broadly, we should not conflate indicators of education with the real thing. As Ofsted chief inspector Amanda Spielman put it recently, we have to be careful not to ‘mistake badges and stickers for learning itself’ and not lose our focus on the ‘real substance of education’.

There is no technical substitute for professionals asking questions like these to reach informed and critical interpretations of their data. The fact that confidence intervals do not address or even connect to any of the points above (including the last) should shed light on why they tell us virtually nothing useful about school effectiveness — and why I tend to advise my students to largely ignore them.

So next time you are looking at your progress scores, have a look at the questions above and critically examine how much the data reveal about your school’s performance (and don’t take too much notice of the confidence intervals).

Time for an honest debate about grammar schools

This blog piece was co-authored with Rebecca Morris (@BeckyM1983). It was originally published on The Conversation (link) (July, 2016)


With Theresa May as the new prime minister at the helm of the Conservatives, speculation is already mounting about whether her support for a new academically selective grammar school in her own constituency will translate into national educational policy. This will be a big question for her newly appointed secretary of state for education, Justine Greening.

The debate between those who support the reintroduction of grammar schools and those who would like them abolished is a longstanding one with no foreseeable end in sight. In 1998 the Labour prime minister Tony Blair attempted to draw a line under the issue by preventing the creation of any new selective schools while allowing for the maintenance of existing grammar schools in England. Before becoming prime minister, David Cameron dismissed Tory MPs angry at his party’s withdrawal of support for grammar schools by calling the debate “entirely pointless”.

This is an issue that continues to resurface and recently became even more pressing with the government’s decision in October 2015 to allow a school in Tonbridge, Kent, to open up an annexe in Sevenoaks, ten miles away. This decision has led to the very real possibility of existing grammar schools applying for similar expansions. Whether or not more will be given permission to do so in the years ahead, many existing grammar schools are currently expanding their intakes.

This latest resurgence of the debate is playing out in an educational landscape which has been radically reformed since 2010. Old arguments about what type of school the government should favour have little traction or meaning in an education system deliberately set up around the principles of autonomy, diversity and choice. Meanwhile, much of the debate continues to ignore and distort the bodies of evidence on crucial issues such as the effectiveness of selection, fair access and social mobility.

It is against this backdrop that we completed a recent review looking at how reforms to the education system affect the grammar school debate and examined the evidence underpinning arguments on both sides.

Old debates, new system

Grammar schools have been re-positioning themselves within the newly-reformed landscape. Notably, 85% of grammar schools have now become academies – giving them more autonomy. Turning a grammar school into an academy is now literally a tick-box exercise. Adopting a legal status that ostensibly keeps the state at arms-length while granting autonomy over curriculum and admissions policies has had a strong appeal for grammar schools.

New potential roles for grammar schools have also opened up. We are seeing the emergence of new structures and forms of collaboration, such as multi-academy trusts, federations and other partnerships. Supporters argue that grammar schools can play a positive role within these new structures, offering leadership within the system. Notable examples include the King Edward VI foundation in Birmingham which in 2010 took over the poorly-performing Sheldon Heath Community Arts College. There are also current proposals for the foundation to become a multi-academy trust.

Construction of the new annexe for a grammar school in Sevenoaks. Gareth Fuller/PA Archive

The Cameron government’s quasi-market approach to making education policy – and that of New Labour before him – has favoured looser and often overlapping structures that allow for a diversity of provision and responsiveness to demand. The central focus is on standards rather than a state-approved blueprint for all schools. This involves intervention where standards are low and expansion where standards are high and there is demand for places.

This policy approach neither supports nor opposes grammar schools – it tries to sidestep the question entirely, leaving many concerns about fair access and the impact of academic selection unanswered.

Fair access

A disproportionately small number of disadvantaged pupils attend grammar schools. Contrary to the claims of grammar school proponents, the evidence shows that these disparities in intake are not entirely accounted for by the fact that grammar schools are located in more affluent areas nor by their high-attaining intake.

Yet grammar schools (and academies) are in a position to use their control over admissions policies and application procedures to seek more balanced intakes and fairer access should they wish to do so. Whether or not they have the ability or inclination remains to be seen.

The issue of school admissions is a good example of where the public debate has failed to keep pace with the realities of the system. Previous research by the Sutton Trust found that some of the most socially selective schools in the country are comprehensive schools, at least in name.

Pitting comprehensive schools against grammar schools, therefore, only loosely grasps the issue of social selectivity. With its emphasis on school types this distracts from the larger issue: the content of the school admissions code and how to ensure compliance with it. If more balanced school intakes are desired, the focus should be on rules around admissions and permissible over-subscription criteria for all schools.

What are grammar schools the answer to?

Much of the current debate is predicated on the superior effectiveness of grammar schools. But the evidence we have reviewed suggests that the academic benefit of attending a grammar school is relatively small. Even these estimates are likely to be inflated by differences in intake that are not taken into account in the statistics.

Evidence on selection, both as part of the education system itself and within schools through setting or streaming, suggest there is little overall benefit to children’s academic achievement. The overall effect is, at best, zero-sum and most likely negative, with higher-attaining pupils benefiting at the expense of lower-attaining pupils, leading to an increase in inequality. The question remains whether that is a price worth paying.

Why new school performance tables tell us very little about school performance

This blog piece was originally published on The Conversation (link) (January, 2017)


The latest performance tables for secondary and primary schools in England have been released – with parents and educators alike looking to the tables to understand and compare schools in their area.

Schools will also be keen to see if they have met a new set of national standards set by the government. These new standards now include “progress” measures, which are a type of “value-added measure”. These compare pupils’ results with other pupils who got the same exam scores as them at the end of primary school.

Previously, secondary schools were rated mainly by raw GCSE results. This was based on the number of pupils getting five A to C GCSEs. But because GCSE results are strongly linked to how well pupils perform in primary school, it tended to be that these previous performance tables told us more about school intakes than actual performance. So under the new measures, schools are judged by how much progress students make compared to other pupils of a similar ability.

This means that it is now easier to identify schools that have good results despite low starting points. As well as schools with very able students who are making relatively little progress compared to able pupils at other schools.

But even with these fairer headline measures, the tables still tell us relatively little about school performance. This is because there are serious problems with the use of these types of “value-added measures” to judge school performance – as my new research shows. I have outlined the main issues below:

Intake biases

Taking pupils’ starting points into account when judging school performance is a step in the right direction, because this means that schools are held accountable for the progress pupils make while at the school. It also focuses schools’ efforts on all pupils making progress rather than just those on the C/D grade borderline which was so crucial for success in the previous measure.

But school intakes differ by more than their prior exam results. My study finds that over a third of the variation in the new secondary school scores can be accounted for by a small number of factors such as the number of disadvantaged pupils at a school, or pupils at the school for whom English is not their first language. This means the new measure is still some way off “levelling the playing field” when comparing school performance.

New measures don’t level the playing field. Shutterstock

In my research, I examined how much school scores would change if these differences in context were taken into account. While schools with a “typical” intake of pupils may be largely unaffected, schools working in the most or least challenging areas could see their scores shifting dramatically. I found this could be by as much as an average of five GCSE grades per pupil across their best eight subjects. And these are just the “biases” we know about and have measures for.

Unstable over time

My research also replicated previous research which found that secondary school performance is only moderately “stable” over time when looking at relative progress. This can be seen in the fact that less than a quarter of the variation in school scores can be accounted for by school performance three years earlier. I also extended this to primary school level where I found stability to be lower still.

The recent “value-added” progress measures are slightly more stable than the former “contextualised” measure – which took many pupil characteristics as well as previous exam results into account. But given “biases” relating to intakes, such as strong links with pupil disadvantage, higher stability is probably not a good thing and most likely reflects differences in school intakes. The real test is whether the measure is stable when these “predictable biases” are removed.

Poorly reflect range of pupils

League tables by their very nature give the scores for a single group in a single year. This means the performance of the year group that left the school last year (as given in the performance tables) reveals very little about the performance of other year groups – and my research supports this. I looked at pupils in years three to nine – ages seven to 14 – to examine the performance of different year groups in the same school at a given point in time.

Even very high or low performing schools tend to have a huge range of pupil scores. Shutterstock

I found that even the performance of consecutive year groups – so years six and five – were only moderately similar. For cohorts separated by two or more years, levels of similarity were also found to be low. This inconsistency can also be seen within a single year – where even very high or low performing schools tend to have a huge range of pupil scores.

This all goes to show that school performance tables are not a true or fair reflection of a school’s performance. While there is certainly room to improve this situation, my research suggests that relative progress measures will never be a fair and accurate guide to school performance on their own.

Progress 8, Ability bias and the ‘phantom’ grammar school effect

As discussed in an excellent Education Datalab post (here), the government is judging schools using Progress metrics which are strongly related to schools’ average intake attainment and have a large grammar school ‘effect’. As the article’s author, Dr (now Professor) Rebecca Allen notes, ‘​The problem is that we don’t know why.’

My most recent research provides an answer. Namely, that this effect is almost entirely down to a measurement bias (rather than genuine differences in school effectiveness).

I wrote an ‘Expert Piece’ in Schools Week about this to try and get the message out. Understandably, my word limit was tight and diagrams or any semi-technical terms were not permitted. So this blog fills in the gap between the full research paper (also available here) and my Schools Week opinion piece, providing an accessible summary of what the problem is and why you should care.

The Ability Bias and Grammar School Effect

Take a look at the relationship between Progress 8 and average KS2 APS in the 2017 (final) secondary school scores:

ability bias 2017

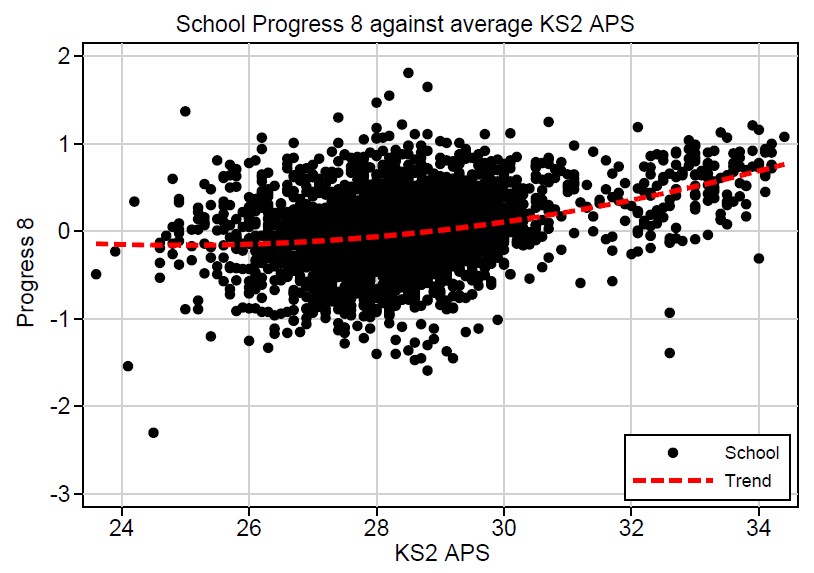
One hardly needs the trend line to see an upwards pointing arrow in the school data points. As one moves to the right (average KS2 APS is higher), Progress 8 tends to increase. As Education Datalab’s Dave Thomson points out, likely explanations include (I quote):

  1. Their pupils tend to differ from other pupils with similar prior attainment in ways that have an effect on Key Stage 4 outcomes. They may tend to receive more support at home, for example;
  2. Their pupils have an effect on each other. Competition between pupils may be driving up their performance. There may be more time for teaching and learning due to pupils creating a more ordered environment for teaching and learning through better behaviour; or
  3. They may actually be more effective. They may be able to recruit better teachers, for example, because they tend to be the type of school the best teachers want to work.

There is one explanation missing from this list: namely, measurement error prevents the Progress scores fully correcting for intake ability and biases remain in the school-level scores.

In my paper I conclude that this is the most likely explanation and measurement error alone produces bias remarkably similar to that seen in the graph above. To find out why, read on:

What causes this bias?

Technical Explanation:

A technical answer is that this the observed peer ability effect is caused by a so-called ‘Phantom’ compositional effect produced by regression attenuation bias (NB. For stats nerds, I realise the Progress scores are not produced using regressions and discuss in the paper how ‘attenuation bias is not a peculiarity of certain regression equations or value-added models and will also affect the English ‘Progress’ scores’. Also see non-technical explanation below).

Non-technical Explanation (based on my Schools Week piece):

Put very simply, if we have imperfect measures of prior attainment, we will get an incomplete correction for ability. We will end up with some middle ground between the original KS4 scores – which are strongly correlated with intake prior attainment – and a perfect school value-added score for which intake ability doesn’t matter.

The problem is caused by two issues:

Issue 1: Shrinking expectations (technically, regression attenuation bias)

Progress 8 expectations rely on the relationship between KS2 and KS4 scores. As error increases, this relationship breaks down as pupils of different ability levels get mixed up. Imagine that the KS2 scores were so riddled with error that didn’t predict KS4 scores at all. In this scenario, our best expectation would be the national average. At the other extreme, imagine a perfect KS2 measure. Our expectations would be perfectly tailored to all pupils’ actual ability levels. With normal levels of error, we end up at an interim position between these where the relationship moderately breaks down and the expectations shrink a little to the national average (and consider what happens to the value-added as they do).

If you are interested in exactly what causes this – I have written a short explanation here (with a handy diagram).

Issue 2: ‘Phantom’ effects

Up until now, the conventional wisdom was that there is going to be some level of unreliability in the test scores, but much of this would cancel out in the school averages (some students get lucky, others unlucky, but it evens out as cohorts get larger) and tests were designed to avoid systematic biases (although of course this is contested). So there was no reason to think that random error could produce systematic bias.

It turns out this is wrong. Here’s why:

The second issue here is that of ‘Phantom’ effects, where measurement error creates relationships between school average scores (e.g. between KS2 and KS4 school scores) despite the relationship being corrected using the pupil scores. Researchers have known about this for some time and have been wrestling with how to measure the effect of school composition (e.g. average ability) without falling for phantoms.

A big conceptual barrier for thinking clearly about this is that relationships and numbers can behave very differently depending whether you are using averages or individual scores. The English Progress measures use individual pupil Key Stage scores. School averages are created afterwards. The data points on the Education Datalab graph mentioned above (here) are all school averages.

The designers of the Progress measures did a great job of eliminating all observable bias in the pupil scores. They had their hands tied however when designing the measures (see p.6 here) when it came to correcting anything else. When we work out the school averages, the relationship between KS2 and KS4 pops up again – a ‘phantom’ effect!

Why does this happen? If a gremlin added lots of random errors to your pupil’s KS2 scores overnight, this would play havok with any pupil targets/expectations based on KS2 scores, but it might have little effect on your school average KS2 score. The handy thing about averages is that a lot of the pupil errors cancel out.

This applies to relationships as well. It is not just the school average scores which hold remarkably firm as we introduce errors into pupil scores, it is the relationships between them. As we introduce errors into the pupils’ scores – due to errors cancelling out – each school’s average would be left largely unaffected – leaving the relationship between school average KS2 and KS4 intact.

In other words, as measurement error is increased, a relationship will break down more in the pupil scores than for school averages. This means that to some extent, the school level KS2-KS4 relationship will be what left over from an incomplete correction of the pupil scores and an apparent (phantom) ‘compositional’ effect pops up. In the words of Harker And Tymms (2004) – the school averages ‘mop-up’ the relationship obscured by error at the pupil-level.

The Progress 8 measures only correct for pupil scores. They do not take school averages into account. If there is KS2 measures error – which there will be (especially judging it be recent years events!) – the correction at pupil level will inevitably be incomplete. The school averages will therefore mop this up, resulting in an ability bias.

Okay, so that’s the theory. Does this matter in practice?

This effect is inevitable to some extent. But it might not be serious. The big question I set out to answer in my research paper was how big the bias will be in the English Progress measures for typical rates of KS2 measurement error.

I used reliability estimates based on Ofqual research and ran simulations using the National Pupil Database. I used several levels of measurement error which I labelled small, medium and large (where the medium was the best estimate based on Ofqual data).

I found that KS2 measurement error produces a serious ability bias, complete with a ‘phantom grammar school effect’. For the ‘medium’ error, the ability bias and the (completely spurious) grammar school effect were remarkably similar to the one seen in the actual data (as shown in the graph above).

I also looked at the grammar school effect in DfE data from 2004-2016, finding that it lurched about from year to year and with changes in the value-added measure (to CVA and back) and underlying assessments.

What should we do about this?

There is a quick and easy fix for this: correct for the school-level relationship, as shown visually in the aforementioned Education Datalab post. (There are also so more technical fixes involving estimating baseline measurement reliability and then correcting for it in the statistical models). Using the quick-fix method, I estimate in my paper that about 90% of the bias can be removed by adjusting for school average prior attainment.

Here’s what that would look like (using final 2017 data):

adjusted by prior attainment 2017

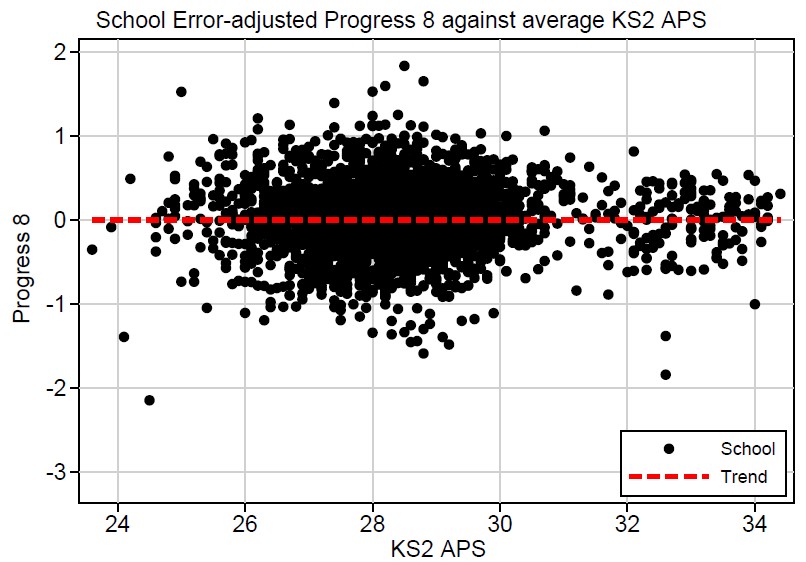
While this is technically easy to do, there are enormous political and practical ramifications of making a correction which would substantially shift all Progress scores – primary and secondary – across the board and would eliminate the grammar school effect entirely. Schools with particularly low or high ability intakes, grammar schools especially, will find themselves with a markedly different Progress scores. This might prove controversial…

But it is in keeping with the clear principle behind the Progress measures: schools should be judged by the progress their pupils make rather than the starting points of their pupils. We just need to add that schools should not be advantaged or disadvantaged by the average prior attainment of their intake any more than that of individual pupils.

There is a whole other argument about other differences in intakes (so-called contextual factors). Other researchers and I have examined the (substantial) impact on the school scores of ignoring contextual factors (e.g. here) and there is strong general agreement amongst researchers that contextual factors matter and have predictable and significant effects on pupil performance.

Here the issue is more fundamental: by only taking pupil-level prior attainment scores into account, the current Progress measures do not even level the playing field in terms of prior attainment (!)

Links and References

  • See my the Schools Week article here
  • The article will be in print shortly and is currently available online for those with university library logons and, for those without university library access, the accepted manuscript is here
  • I have also produced a 1-page summary here

I have not provided citations/references within this blog post but – as detailed in my paper – my study builds on and is informed by many other researchers to whom I am very grateful. Full references can be found on my journal paper (see link above).


Attenuation bias explained (in diagrams)

Below is a simple representation of 45 pupils’ prior attainment on a simple 7-point score. Imagine these are KS2 scores used as the baseline to judge KS2-4 ‘Progress’, as in the Progress 8 measure. To create the Progress 8 measure the average KS4 score is found for each KS2 score (in this example, 7 KS4 ‘expected’ average scores would be found and used to judge pupils KS4 scores against others with the same KS2 score.

Attenuation bias fig 1

Above are the ‘true’ scores, i.e. measured without any error. Let’s see what happens when we introduce random measurement error into this. Below are the same pupils on the same scale, but 1 in 5 of each group of 5 have received a positive error (+) and have been bumped up a point on the scale and 1 in 5 have received a negative error (-) and have been bumped down a point.

Attenuation bias fig 2

There were originally 15 pupils with a score of 4. Now 3 of these have a higher score of 5 (see the 3 red pupils in the 5 box) and 3 have a lower score of 3 (see the 3 green pupils in the 3 box). Remember these are the observed scores. In reality, we do not know the true scores and will not be able to see which received positive or negative errors.

Now ask, what would happen if we were to produce a KS4 score ‘expectation’ from the average KS4 score for all pupils in box 5? There are some with the correct true score who would give us a fair expectation. There are some pupils whose true scores are actually 4 and would, on average, perform worse, bringing the average down. There is one pupil whose true score is higher and would pull the average up. Crucially, the less able pupils are more numerous than the more able and the average KS4 score for this group will drop.

The important thing to notice here is that – above the mean score of 4 – the number of pupils with a positive error outweighs the number with a negative error. Below the mean score of 4, the opposite is true. Calculating expected scores in this context will shrink (or ‘attenuate’) all expectations towards the mean score. As the expected scores shrink towards the mean score, what happens to value-added (‘Progress’)? It gets increasingly positive for pupils whose true ability is above average and increasingly negative for those who are below average. Lots of spurious ‘Progress’ variation is created and higher ability pupils are flattered.