School progress measures are a missed opportunity for a fairer and more informative approach

This blog piece was originally published on The University of Birmingham’s Social Sciences  Blog (link) (May, 2018)


The Progress 8 measures of school performance compare pupils’ GCSE results across 8 subjects to those of other pupils with the same primary school SATs results. There are many reasons behind the differences we see in the scores, many of which have nothing to do with school quality. They tell us surprisingly little about school performance.

It is easy to find fault in performance measures, and there is certainly a lot of ammunition to do this in the case of the Progress 8 measures. However, in my research, I work towards improving education policy and practice, rather than merely criticising the status quo. So here are five ways to reform the school Progress measures:

1. Fix the ability bias:

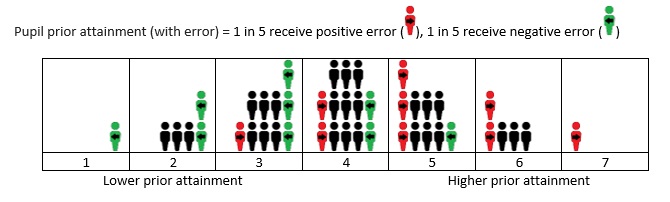
Progress measures help us see pupil progress relative to similar-ability peers in other schools. But, as my recent research has shown, error in the measures used to estimate ability means that a sizable ‘ability bias’ remains, giving a particularly large advantage to selective grammar schools. Ability bias can be rectified by looking at average school starting points as well the starting points for individual pupils (or more sophisticated methods which estimate and correct for measurement unreliability).

2. Replace or supplement Progress 8 with a measure that  takes context into account:

My paper, published when the first Progress measures were introduced in 2016 found that around a third of the variation in Progress 8 can be accounted for by a small number of school intake characteristics such as the proportion of pupils on free school meals and/or with English as an additional language (EAL). Using more sophisticated measures would reveal further predictable differences unrelated to school quality (e.g. considering EAL groups, the number of years pupils are on Free School Meals, or factors such as parental education). We must guard against measures excusing lower standards for disadvantaged groups. But not providing contextualised estimates leaves us with little more than impressions on how interacting contextual factors influence outcomes and no one in a position to make data-informed judgements.

3. Create measures which smooth volatility over several years:

Progress 8 is highly affected by unreliable assessments and statistical noise. Only a tiny portion of Progress 8 variation is likely to be due to differences in school performance. A large body of research has revealed very low rates of stability for progress (value-added) measures over time. Judging a school using a single year’s data is like judging my golfing ability from a single hole. A school performance measure based on a 2- or 3-year rolling average would smooth out volatility in the measure and discourage short-termism.

4. Show the spread, not the average:

It is not necessary to present a single score rather than, for example, the proportion of children in each of 5 progress bands, from high to low. Using a single score means that, against the intentions of the measure, the scores of individual students can be masked by the overall average and downplayed. Similarly, the measure attempts to summarise school performance across all subjects using a single number. Schools have strengths and weaknesses and correlations between performances across subject are moderate at best.

5. Give health warnings and support for interpretation:

Publishing the Progress measures in ‘school performance tables’ and inviting parents to ‘compare school performance’ does little to encourage and support parents to consider the numerous reasons why the scores are not reflective of school performance. Experts have called for, measures to be accompanied by prominent ‘health warnings’ if published. Confidence intervals are not enough. The DfE should issue and prominently display guidance to discourage too much weight being placed on the measures.

Researchers in this field has worked hard to make the limitations of the Progress measures known. The above  recommendations chime with many studies and professional groups calling for change.

Trustworthy measures of school performance are currently not a realistic prospect. The only way I can see them being informative is through use in a professional context, alongside many other sources of evidence – and even then I have my doubts.

Advertisement

How much confidence should we place in a progress measure?

This blog piece was originally published on the SSAT Blog (link) (December, 2017)


Our latest cohort of students, all current or aspiring school leaders, have been getting to grips with school performance tables, Ofsted reports, the new Ofsted inspection dashboard prototypes, the Analyse School Performance (ASP) service and some examples of school tracking data. As they write their assignments on school performance evaluation, I realise others might be as interested as I have been in what we are learning.

There was a general agreement in the group that using progress (ie value-added) indicators rather than ‘raw’ attainment scores give a better indication of school effectiveness. As researchers have known for decades and the data clearly show, raw attainment scores such as schools’ GCSE results say more about schools’ intakes than their performance.

Measuring progress is a step in the right direction. However, as I pointed out in an (open access) research paper on the limitations of the progress measures back when they were introduced, a Progress 8 measure that took context into account would shift the scores of the most advantaged schools enough to put an average school below the floor threshold, and vice versa.

Confidence lacking in confidence intervals

Recent research commissioned by the DfE suggests that school leaders recognise this and are confident about their understanding of the new progress measures. But many are less confident with more technical aspects of the measure, such as the underlying calculations and, crucially, the accompanying ‘confidence intervals’.

Those not understanding confidence intervals are in good company. even the DfE’s guidance mistakenly described confidence intervals as ‘the range of scores within which each school’s underlying performance can be confidently said to lie’. More recent guidance added the caveats that confidence intervals are a ‘proxy’ for the range of values within which we are ‘statistically’ confident that the true value lies. These do little, in my view, to either clarify the situation or dislodge the original interpretation.

A better non-technical description would be that confidence intervals are the typical range of school progress scores that would be produced if we randomly sorted pupils to schools. This provides a benchmark for (but not a measure of) the amount of ‘noise’ in the data.

Limitations to progress scores

Confidence intervals have limited value however for answering the broader question of why progress scores might not be entirely valid indicators of school performance.

Here are four key questions you can ask when deciding whether to place ‘confidence’ in a progress score as a measure of school performance, all of which are examined in my paper referred to above on the limitations of school progress measures:

  1. Is it school or pupil performance? Progress measures tell us the performance of pupils relative to other pupils with the same prior attainment. It does not necessarily follow that differences in pupil performance are due to differences in school (ie teaching and leadership) performance. As someone who has been both a school teacher and a researcher (about five years of each so far), I am familiar with the impacts of pupil backgrounds and characteristics both on a statistical level, looking at the national data, and at the chalk-face.
  2. Is it just a good/bad year (group)? Performance of different year groups (even at a single point in time) tends to be markedly different, and school performance fluctuates over time. Also, progress measures tell us about the cohort leaving the school in the previous year and what they have learnt over a number of years before that. These are substantial limitations if your aim is to use progress scores to judge how the school is currently performing.
  3. Is an average score meaningful? As anyone who has broken down school performance data by pupil groups or subjects will know, inconsistency is the rule rather than the exception. The research is clear that school effectiveness is, to put it mildly, ‘multi-faceted’. So asking, ‘effective for whom?’ and, ‘effective at what?’ is vital.
  4. How valid is the assessment? The research clearly indicates that these measures have a substantial level of ‘noise’ relative to the ‘signal’. More broadly, we should not conflate indicators of education with the real thing. As Ofsted chief inspector Amanda Spielman put it recently, we have to be careful not to ‘mistake badges and stickers for learning itself’ and not lose our focus on the ‘real substance of education’.

There is no technical substitute for professionals asking questions like these to reach informed and critical interpretations of their data. The fact that confidence intervals do not address or even connect to any of the points above (including the last) should shed light on why they tell us virtually nothing useful about school effectiveness — and why I tend to advise my students to largely ignore them.

So next time you are looking at your progress scores, have a look at the questions above and critically examine how much the data reveal about your school’s performance (and don’t take too much notice of the confidence intervals).

Attenuation bias explained (in diagrams)

Below is a simple representation of 45 pupils’ prior attainment on a simple 7-point score. Imagine these are KS2 scores used as the baseline to judge KS2-4 ‘Progress’, as in the Progress 8 measure. To create the Progress 8 measure the average KS4 score is found for each KS2 score (in this example, 7 KS4 ‘expected’ average scores would be found and used to judge pupils KS4 scores against others with the same KS2 score.

Attenuation bias fig 1

Above are the ‘true’ scores, i.e. measured without any error. Let’s see what happens when we introduce random measurement error into this. Below are the same pupils on the same scale, but 1 in 5 of each group of 5 have received a positive error (+) and have been bumped up a point on the scale and 1 in 5 have received a negative error (-) and have been bumped down a point.

Attenuation bias fig 2

There were originally 15 pupils with a score of 4. Now 3 of these have a higher score of 5 (see the 3 red pupils in the 5 box) and 3 have a lower score of 3 (see the 3 green pupils in the 3 box). Remember these are the observed scores. In reality, we do not know the true scores and will not be able to see which received positive or negative errors.

Now ask, what would happen if we were to produce a KS4 score ‘expectation’ from the average KS4 score for all pupils in box 5? There are some with the correct true score who would give us a fair expectation. There are some pupils whose true scores are actually 4 and would, on average, perform worse, bringing the average down. There is one pupil whose true score is higher and would pull the average up. Crucially, the less able pupils are more numerous than the more able and the average KS4 score for this group will drop.

The important thing to notice here is that – above the mean score of 4 – the number of pupils with a positive error outweighs the number with a negative error. Below the mean score of 4, the opposite is true. Calculating expected scores in this context will shrink (or ‘attenuate’) all expectations towards the mean score. As the expected scores shrink towards the mean score, what happens to value-added (‘Progress’)? It gets increasingly positive for pupils whose true ability is above average and increasingly negative for those who are below average. Lots of spurious ‘Progress’ variation is created and higher ability pupils are flattered.